EMF Testing Tools: A Practical, Data-Informed Guide for Homes & Workspaces
Electromagnetic fields (EMF) are part of daily life: Wi-Fi, cellular, Bluetooth, smart meters, appliances, and wiring all create fields across different frequencies. The right EMF testing tools help you identify sources, quantify exposure, and verify whether mitigations (distance, power settings, or shielding) are actually working. This guide explains what each meter measures, how to interpret readings, and how to build a sensible toolkit from entry level to professional.
What “EMF” Means (and Why Tools Differ)
“EMF” is an umbrella term. Different sources emit different kinds of fields, so no single meter measures everything:
- Extremely Low Frequency (ELF) fields from power systems (50/60 Hz and harmonics):
- Magnetic flux density (B-field), measured in mG or µT
- Electric field strength (E-field), measured in V/m
- Radiofrequency (RF) fields from wireless technologies (kHz-GHz):
- Electric field strength (V/m)
- Power density (µW/m² or mW/m²)
- Sometimes peak vs average readings
Because each band behaves differently (near-field vs far-field, coupling to your body, reflections), you select tools by frequency and quantity (E-field, B-field, power density) not by brand alone.
Core Categories of EMF Testing Tools
Each kind of field needs its own meter, so choose by what you want to measure
Measured in mG or µT
From current in wiring, power lines, motors and appliances. Read it with a gaussmeter or the magnetic mode of a multi-field meter.
Measured in V/m
From voltage on unshielded cords and wiring, even with nothing switched on. Read it with an electric-field mode; grounding changes the reading.
Measured in µW/m² or V/m
From phones, Wi-Fi, Bluetooth, cell towers and smart meters. Read it with an RF meter whose range covers the bands you care about.
Noise on the wiring
High-frequency noise riding on the mains, conducted rather than radiated. A field meter cannot see it; it needs a plug-in line-noise meter.
A meter that reads one field says nothing about others
Each field type needs its own sensor; a meter that reads one says nothing about the others.
Chart: frequencyblockers.com: Each kind of field needs its own meter, so choose by what you want to measure
Embed this chart
Free to reuse on your site. Copy the code below; please keep the credit link.
1) Magnetic Field Meters (Gaussmeters)
What they do: Measure ELF magnetic fields from transformers, motors, HVAC, induction cooktops, high-current conductors, and house wiring issues.
Specs to watch:
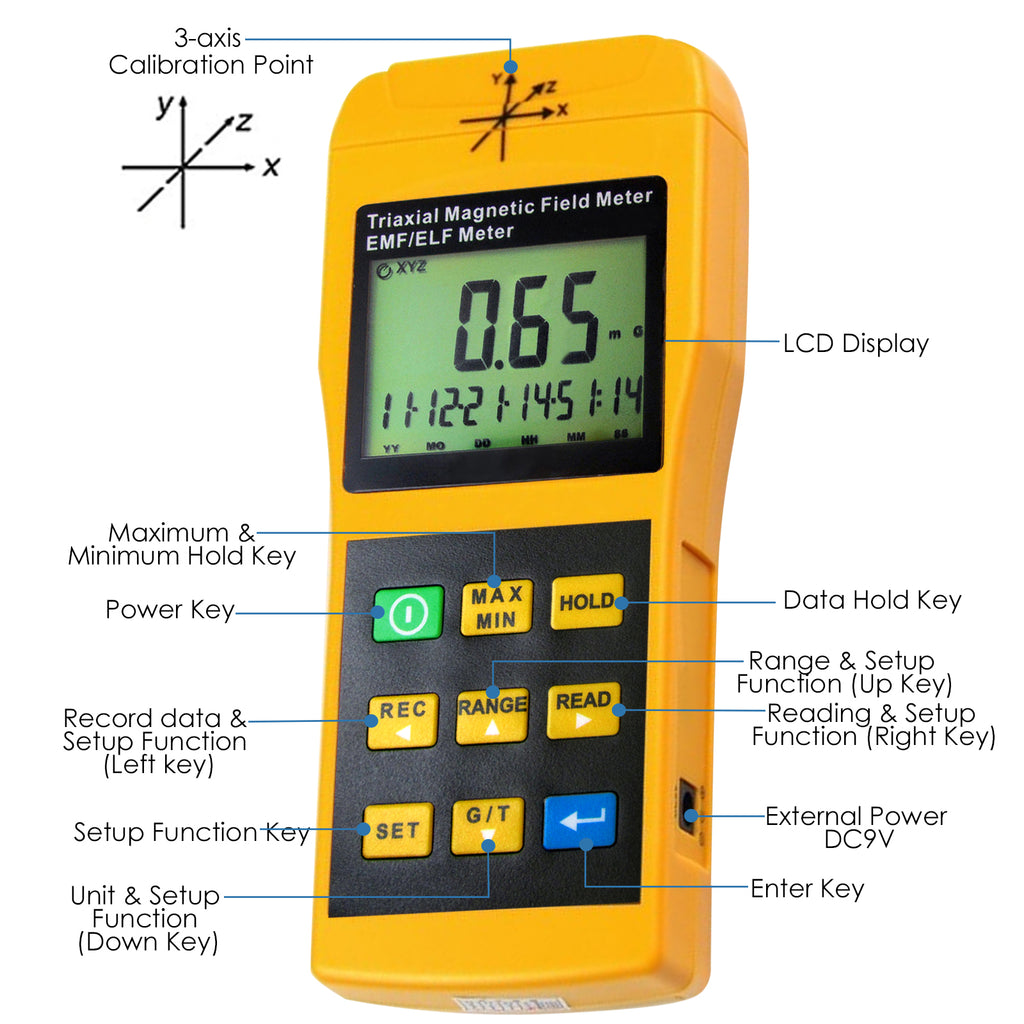
- Axis configuration: Single-axis is fine if you rotate the meter; 3-axis simplifies use.
- Range & resolution: Look for readable resolution down to ~0.1 mG (0.01 µT) and a range up to several tens of mG.
- Bandwidth: Ensure it covers 40 to 1,000 Hz to see harmonics from non-linear loads (dimmers, LED drivers).
Use case highlights: Map magnetic “hot zones” near panels, chargers, aquarium pumps, or the edge of an induction hob. Confirm distance-to-source reductions.


2) ELF Electric Field Meters
What they do: These EMF Testing tools Measure the electric field created by energized wiring, cords, and devices, even when no current flows.
Specs to watch:
- Body voltage vs free-space E-field: Body voltage kits measure how much field couples into you (handy in bedrooms). Free-space E-field meters measure the field in air (V/m).
- Grounding: Accurate E-field measurement generally requires ground reference; some meters include a ground cord or plate.
Use case highlights: Diagnose high E-fields behind beds, along walls with hidden cables, and around power strips. Verify improvements from distance, cable routing, grounded shielding, or turning circuits off overnight.
3) RF Broadband Meters (Survey Meters)
What they do: Provide a wide-band snapshot of RF exposure from Wi-Fi, Bluetooth, DECT phones, smart meters, and nearby cell sites.
Specs to watch:
- Frequency span: Ideally 200 MHz-8 GHz (or wider, to catch 5G mid-band).
- Display modes: Peak-hold (captures bursts), max and average readings, and sound (audio demodulation) to identify signal types by ear.
- Dynamic range: To capture both weak background and strong local transmitters without saturating.
Use case highlights: Walk a property to see where signals spike (router line-of-sight, window facing a tower). Compare before/after access-point relocation, directional shielding, or router power reductions.
4) RF Spectrum Analyzers + Antennas (Pro Tools)
What they do: Resolve frequency-specific information: what channels are active, at what power, and from which direction (with suitable antenna).
Specs to watch:
- Frequency coverage: Match to your problem (e.g., sub-1 GHz for smart meters, 2.4/5 GHz for Wi-Fi, mid-band 5G).
- RBW/VBW & dynamic range: Narrower resolution bandwidth helps distinguish nearby signals; dynamic range keeps strong signals from masking weak ones.
- Antennas: Log-periodic or directional panel antennas help locate sources and assess shielding angles.
Use case highlights: Differentiate your own Wi-Fi from neighbors, quantify leakage paths, and optimize shielding materials or paint with dB-by-frequency results.
5) Personal RF Dosimeters & Wearables
What they do: These EMF Testing tools Clip-on or wearable devices log time-varying exposure as you move through different environments.
Specs to watch:
- Logging interval & memory
- Peak vs average capture
- Frequency weighting (some group bands differently)
Use case highlights: See commute and workplace peaks, compare rooms over a day, or quantify reductions from behavioral changes (e.g., disabling background 5G/Wi-Fi on the go).
6) Accessory EMF Testing Tools (Probes, Grounding, Body Voltage)
- Body voltage meters show how building wiring couples into your body in bed or at a desk.
- Near-field probes (for spectrum analyzers) help trace board-level or cable-level emissions.
- Grounding leads/pads are essential for valid E-field readings and for certain shielding verification tests.
Interpreting Readings Without Hype
Units & What They Mean
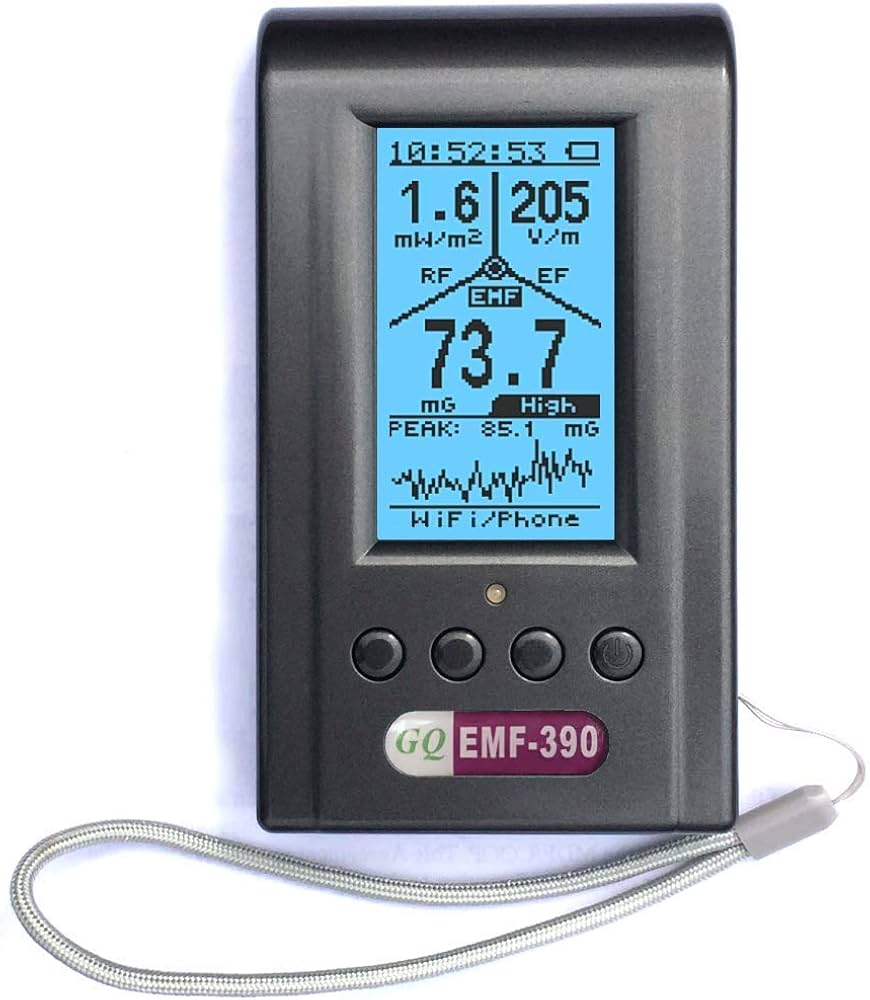
- Magnetic field (B): mG or µT (1 µT = 10 mG). Household background often sits below a few mG; close to motors/transformers it can climb rapidly.
- Electric field (E): V/m in ELF and RF. Near energized wiring, tens to hundreds of V/m are common; RF readings vary widely by proximity and obstructions.
- Power density: µW/m² (or mW/m²) for RF; convenient for broadband comparisons.
Peak vs Average
Wireless bursts (Wi-Fi beacons, LTE/5G scheduling) can create high peaks even when averages look small. Peak-hold readings help capture those brief spikes. Keep in mind that exposure limits are averaged over time, so a brief peak does not by itself mean a limit is exceeded [5][6].
For context, a measurement survey found an average total electric field of 0.1 V/m and a maximum of 1.1 V/m in homes, and in Belgian schools, homes and public places 94% of broadband measurements were below 1 V/m. ICNIRP 2020’s general-public reference level for the 30 to 400 MHz band is 27.7 V/m [7][5].
Background, Source, and Path
Always separate:
- Background (what’s present with everything off),
- Source (a specific device on), and
- Path (how it reaches you: line-of-sight, reflections, cables acting as antennas).
This helps you choose the least-effort fix: move the source, break the path, or reduce the time you spend close to it.
A Simple, Repeatable Home Survey Method
- Plan zones: Sleep, work, kids’ rooms, kitchen, living areas, utility wall.
- Start with RF broadband: Walk each zone. Record peak and average power density at head height and at the pillow for bedrooms.
- Check magnetic fields: Scan panels, floors near big appliances, and beds. Note readings above a few mG and map how they drop with distance.
- Check ELF electric fields: With a grounded E-field meter or body-voltage kit, measure at the pillow and desk. Note improvements when circuits are off or cords repositioned.
- Test one change at a time: Router relocation, lower transmit power, timed Wi-Fi off at night, cable management, ferrites on noisy leads, or distance from chargers.
- Document before/after: Same locations, same meter orientation, similar time of day. Keep photos and a table of readings.
Choosing Tools by Goal (Good/Better/Best)
Good EMF Testing Tools (simple screening on a budget)
- 3-axis gaussmeter for magnetic fields
- Broadband RF meter with peak-hold and audio
- Body-voltage kit (or grounded E-field meter) for bedrooms
Better (more confident decisions)
- RF meter covering 200 MHz-8 GHz with peak, max, average, and sound
- ELF E-field meter with ground reference and adjustable ranges
- Tripod or spacer for consistent test distance
Best EMF Testing Tools (advanced diagnostics & verification)
- Handheld spectrum analyzer with directional antenna(s)
- Near-field probes for cable/device troubleshooting
- Data logging (CSV export) to graph diurnal patterns
- Optional shielding effectiveness kit (see below)
Verifying Shielding Effectiveness (SE) the Right Way
When you apply shielding (paint, mesh, films, fabrics), verify performance:
- Establish a baseline: With emf testing tools like a spectrum analyzer + antenna (best) or a high-quality RF meter, record frequency-specific peaks from the target source (e.g., 2.4 GHz Wi-Fi channel, 700 to 900 MHz LTE band).
- Apply shielding: Paint/wallpaper/mesh/film per manufacturer guidelines (ground where required).
- Measure again, same setup: Same antenna position, polarization, and distance. Calculate SE in dB: SE (dB)=10log10(PunshieldedPshielded)text{SE (dB)} = 10log_{10}left(frac{P_text{unshielded}}{P_text{shielded}}right)SE (dB)=10log10(PshieldedPunshielded) A 20 dB reduction ≈ 99% power reduction; 40 dB ≈ 99.99%; 60 dB ≈ 99.9999%.
- Check for leaks: Windows, door gaps, outlets, HVAC penetrations, floor/ceiling paths. Use a directional antenna to hunt them down.
Tip: Broadband meters can show large before/after drops, but frequency-resolved measurements make optimization faster and more reliable.
Common Measurement Pitfalls (and Fixes)
- Touching the device with your hand: Body coupling changes readings. Use a consistent grip or a tripod on your emf testing tools.
- Meter saturation: If the reading pegs at max, move farther away or switch range.
- No ground for E-fields: ELF E-field values can be meaningless without ground reference.
- Near-field confusion: Very close to devices (within ~λ/2π), instruments behave differently. Maintain a repeatable test distance.
- Peak-only or average-only: Capture both to understand bursts vs baseline.
- Ignoring time of day: Neighborhood RF changes at night; compare like with like.
Example Scenarios
- Home office Wi-Fi: RF meter shows high peaks at the chair. Moving the router to the hallway and reducing transmit power drops peaks dramatically while coverage remains adequate.
- Bedroom wiring: Body-voltage readings are high at the pillow. Flipping an unused circuit off at night and rerouting a lamp cord reduces E-fields.
- Induction cooktop: Gaussmeter shows strong magnetic fields at the pan edge. Increasing distance and using proper cookware lowers readings at the torso.
- Smart meter on exterior wall: RF survey finds a hot spot near a crib. Relocating furniture and adding targeted shielding film on the window reduces peaks.
Basic Meter Care and Calibration
- Calibration: For confidence, choose meters with factory calibration and periodic recalibration options.
- Storage & handling: Avoid drops; keep probes and antennas clean and dry.
- Batteries: Low battery can skew readings: use fresh cells or rechargeables.
- Firmware/software: For loggers and analyzers, keep software updated for stable data export.
Building a Documentation Habit
Create a simple spreadsheet with location, time, tool, range, reading (peak/avg), and notes. Photograph meter position and orientation. Consistent documentation lets you compare interventions and quickly replicate tests later (or share with an EMF consultant if you escalate).
Budget meters have limits. A review found that well-calibrated low-cost RF sensors deviate by about 3-6 dB from professional instruments, and body-worn meters read low: compared with a vest meter, two models read about 0.79 and 0.29 of the true total. Use cheap meters to compare rooms and changes, not to quote exact values [10][11].
Smart meters transmit only briefly: 99.9% of meters measured had a duty cycle of 1.12% or less, and the worst-case time-averaged exposure 0.3 m from a smart meter installation was 5.39% of the FCC/IEEE reference level [8][9].

Key Takeaways for EMF Testing Tools
- Match tool to task. Use gaussmeters for magnetic, grounded E-field tools for ELF electric fields, and RF survey meters or spectrum analyzers for wireless.
- Capture peak and average. Peaks reveal bursts from Wi-Fi/5G; averages show background.
- Test, change one thing, retest. Document before/after to confirm a real improvement.
- Shielding needs verification. Measure frequency-specific reductions and hunt for leaks.
- Consistency beats complexity. A simple, repeatable method yields clearer decisions than sporadic spot checks.
References
- FCCRadio Frequency Safety (consumer RF basics and exposure limits): fcc.gov
- NISTElectromagnetic Compatibility and Telecommunications LAP: nist.gov
- WikipediaFaraday Cage Theory: Wikipedia
- ASTMStandards for Shielding Effectiveness Measurements (overview): astm.org
- International Commission on Non-Ionizing Radiation Protection ICNIRP Guidelines for Limiting Exposure to Electromagnetic Fields (100 kHz to 300 GHz). International Commission on Non-Ionizing Radiation Protection (2020). source
- US Electronic Code of Federal Regulations (FCC) 47 CFR 1.1310 Radiofrequency radiation exposure limits. US Electronic Code of Federal Regulations (FCC) (current). source
- Leen Verloock et al. Assessment of Radio Frequency Exposures in Schools, Homes, and Public Places in Belgium. Health Physics (2014). PMID 25353235
- Tell RA et al. Characterization of radiofrequency field emissions from smart meters. Journal of exposure science & environmental epidemiology (2013). PMID 23131714
- Aerts S et al. Spatial and temporal assessment of radiofrequency electromagnetic fields emitted by smart meters and smart meter banks in urban environments. Environmental research (2020). PMID 32032814
- Rathebe PC et al. Low-Cost Sensors in 5G RF-EMF Exposure Monitoring: Validity and Challenges. Sensors (Basel, Switzerland) (2026). PMID 41600329
- Huss A et al. Exposure to radiofrequency electromagnetic fields: Comparison of exposimeters with a novel body-worn distributed meter. Environment international (2021). PMID 34153890
- De Giudici P et al. Radiofrequency exposure of people living near mobile-phone base stations in France. Environmental research (2021). PMID 33221309
Recommended EMF Testing Equipment
Ready to start testing? Check out our top-rated EMF meters:
- Safe and Sound Pro II RF Meter
- Safe and Sound Classic II RF Meter
- Safe and Sound Pro mmWave 20GHz Meter
Browse all EMF protection products


Frequently Asked Questions
What’s the difference between ELF and RF fields, and why do I need different meters to measure them?
ELF fields come from power systems and operate at 50/60 Hz, measured in milligauss or microtesla, while RF fields come from wireless technologies like Wi-Fi and cellular and are measured in volts per meter or power density. Because each type behaves differently and requires different measurement units, using the right EMF testing tool for your specific concern ensures you get accurate, actionable data rather than misleading readings.
How do I know if my EMF shielding is actually working?
You verify shielding effectiveness by taking readings before and after installation in the same location using the appropriate meter for that field type, then comparing the peak and average values to establish a baseline. The article explains the proper method to avoid common pitfalls like meter placement errors that can make shielding appear more or less effective than it really is.
What’s the simplest way to start testing EMF levels in my home?
Start with an entry-level broadband RF meter or gaussmeter depending on your main concern, take measurements in key locations (bedside, work area, near appliances), and record both peak and average readings to establish your home’s baseline. Following a repeatable survey method helps you identify your highest-exposure areas and track whether mitigation efforts like distance or power setting changes actually reduce your exposure.
Why do peak and average EMF readings matter, and which one should I focus on?
Peak readings capture the highest momentary spikes in exposure while average readings show typical conditions, and both matter because peaks show brief bursts while limits are averaged over time, so a short spike alone does not mean a limit is exceeded [5][6]. Understanding what each number represents helps you avoid overreacting to brief spikes while identifying sustained high-exposure sources worth addressing with distance, shielding, or power adjustments.
These statements have not been evaluated by the Food and Drug Administration. This information is not intended to diagnose, treat, cure, or prevent any disease. Content is for informational purposes only and is not medical advice; consult a qualified healthcare provider before starting any supplement. As an Amazon Associate we earn from qualifying purchases.