RF Spectrum Analyzers: A Complete Guide to High-Frequency EMF Measurement
Radiofrequency exposure is one of the most common forms of electromagnetic energy in modern environments. Wi-Fi routers, smartphones, Bluetooth devices, smart meters, and countless wireless systems transmit RF signals across a wide range of frequencies. To accurately assess them, professionals rely on RF Spectrum Analyzers, highly sensitive tools capable of displaying frequency patterns, peak power levels, and signal activity in real time.
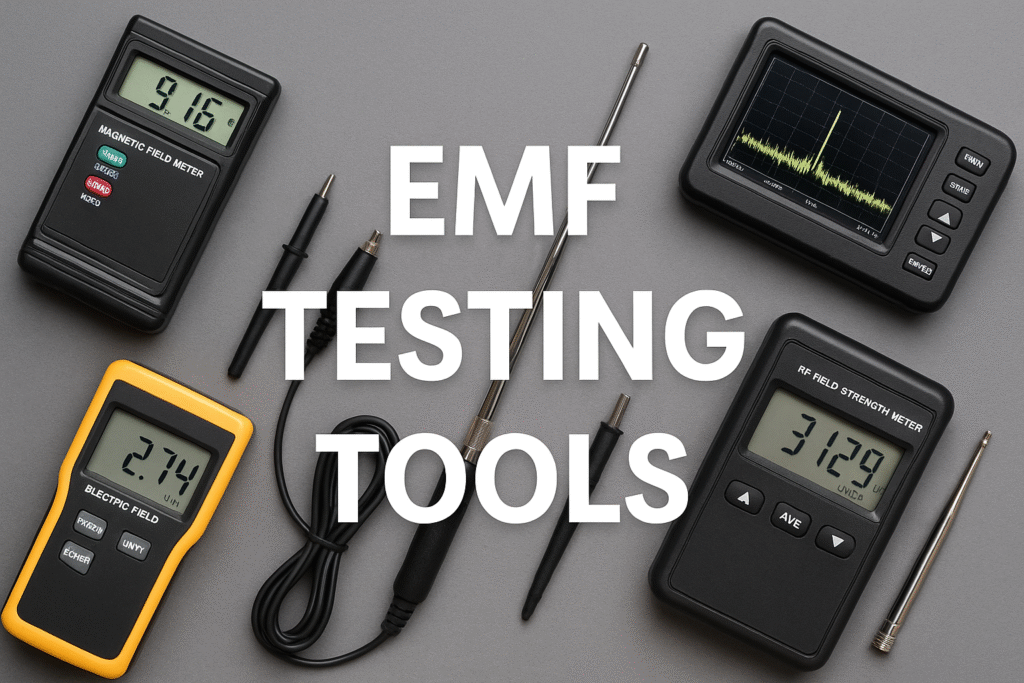
For anyone conducting a serious RF assessment—whether at home, in a business, or in a technical environment—RF Spectrum Analyzers provide unmatched visibility into what is happening across the airwaves. This guide explains how they work, how to select the right model, and how to interpret results with confidence. You can also view our complete overview of EMF testing equipment here:
https://frequencyblockers.com/emf-testing-tools/
What RF Spectrum Analyzers Do
RF Spectrum Analyzers measure and visualize radiofrequency signals. Unlike broadband RF meters that simply show total exposure, these analyzers break down RF emissions by frequency, amplitude, and modulation characteristics. This is essential when identifying specific sources, overlapping signals, or sudden spikes.
Most RF Spectrum Analyzers offer:
- Frequency scanning across a defined range
- Real-time visualization of peaks
- Power-level measurement in dBm or µW/m²
- Identification of dominant transmitters
- Logging and playback for extended analysis
This level of detail makes RF Spectrum Analyzers the preferred diagnostic tool for professionals and advanced home assessors.
How RF Spectrum Analyzers Work
RF Spectrum Analyzers rely on tunable receivers that sweep across frequency bands and measure signal strength at each point. The device then displays these values on a frequency-based graph.
Key components include:
1. Local Oscillator
Allows the analyzer to tune across frequencies during sweeping.
2. Mixer
Combines the incoming RF signal with the oscillator frequency to create an intermediate frequency (IF).
3. IF Filter
Filters out unwanted signals and isolates relevant frequencies.
4. Detector & Display Processor
Converts signal amplitude into visual peaks for interpretation.
Because of this scanning method, RF Spectrum Analyzers can detect everything from narrowband transmissions (like smart meters) to wideband spread-spectrum signals (like Wi-Fi and Bluetooth).
Why RF Spectrum Analyzers Are Essential for EMF Assessments
RF exposure is more complex than magnetic or electric fields. It varies constantly based on transmission duty cycles, distance, interference, and modulation schemes. RF Spectrum Analyzers help bring clarity to this dynamic environment.
Key use cases include:
1. Identifying Specific RF Sources
- Wi-Fi routers
- Bluetooth devices
- Cell towers
- Smart meters
- Security systems
- Vehicle keyless entry systems
Broadband meters cannot separate these signals. RF Spectrum Analyzers can.
2. Measuring Peak Exposure
RF devices often transmit in pulses. Peaks are important for understanding biological impact and interference concerns.
3. Detecting Hidden or Intermittent Signals
Some systems transmit only occasionally:
- Wireless thermostats
- Zigbee devices
- Baby monitors
- Utility telemetry
These patterns become visible through spectrum analysis.
4. Troubleshooting Wireless Interference
Businesses often use RF Spectrum Analyzers to diagnose:
- Poor Wi-Fi performance
- Overlapping channels
- Interference from neighboring buildings
Types of RF Spectrum Analyzers
There are several categories, each suited to different applications.
1. Handheld RF Spectrum Analyzers
Portable devices designed for field use.
- Pros: Compact, real-time measurement, good for home assessments
- Cons: Limited resolution and dynamic range compared to benchtop models
2. Benchtop RF Spectrum Analyzers
Laboratory-grade instruments.
- Pros: Extremely precise, wide frequency ranges, used in engineering and telecommunications
- Cons: Expensive and not portable
3. USB-Based RF Spectrum Analyzers
Connect to a computer and rely on software for analysis.
- Pros: Affordable, flexible visualization
- Cons: Require a laptop and may have reduced dynamic range
4. Software-Defined Radio (SDR) Tools
DIY testing options using configurable digital receivers.
- Pros: Low-cost, customizable
- Cons: Requires technical expertise, not calibrated for safety standards
How to Use RF Spectrum Analyzers
1. Select the Correct Frequency Range
Typical consumer RF frequencies include:
- 700–2,600 MHz (cellular)
- 2.4 & 5 GHz (Wi-Fi)
- 900 MHz (smart meters & cordless phones)
- 2.4 GHz (Bluetooth)
Ensure your analyzer covers the entire range you intend to evaluate.
2. Set Resolution Bandwidth (RBW)
Smaller RBW = more detail.
Larger RBW = faster scanning.
3. Choose Peak, Average, or Max Hold Modes
- Peak Mode: Identifies highest pulses
- Average Mode: Smooths the entire signal
- Max Hold: Shows worst-case exposure over time
4. Scan the Environment Slowly
Walk through the testing area and observe how peaks change with distance and orientation.
5. Record Data
Log:
- Peak levels
- Frequencies involved
- Time of day
- Location of dominant sources
This documentation helps with mitigation planning.
Interpreting RF Spectrum Analyzer Readings
RF exposure is measured in several ways:
1. Amplitude (Power Level)
Common units include:
- dBm (decibel-milliwatts)
- µW/m² or mW/m²
Higher peaks indicate stronger RF transmissions.
2. Frequency Signature
Each device type has characteristic patterns. For example:
- Wi-Fi shows wideband bursts
- Smart meters show narrow, periodic pulses
- Bluetooth shows hopping patterns across the 2.4 GHz band
3. Duty Cycle
Some transmit constantly, others intermittently.
Understanding duty cycle helps assess actual exposure.
Selecting the Best RF Spectrum Analyzers for Home or Professional Use
Choosing the right model depends on your goals.
Important factors include:
1. Frequency Coverage
Minimum recommended range for home testing:
- 50 MHz to 6 GHz
Professional-grade models extend far higher.
2. Dynamic Range
Determines ability to detect weak signals near strong ones.
3. Display Refresh Rate
Higher refresh = better for detecting pulsed transmissions.
4. Antenna Compatibility
Different antennas are optimized for different frequencies.
5. Portability & Battery Life
Critical for field testing.
Price Ranges for RF Spectrum Analyzers
| Category | Typical Price | Best For |
|---|---|---|
| Entry-Level | $150–$400 | Home users, simple RF detection |
| Mid-Range | $400–$1,200 | Professional EMF assessors |
| High-End | $1,200–$10,000+ | Engineering & telecom diagnostics |
The price variation reflects the complexity of RF analysis and precision required for accurate readings.
Common Pitfalls When Using RF Spectrum Analyzers
Avoid the following mistakes:
- Using the wrong antenna for the frequency range
- Setting RBW too wide or too narrow
- Standing too close to the analyzer
- Ignoring peak hold data
- Failing to account for signal reflections from walls and metal surfaces
- Assuming a single reading represents average exposure
RF environments are dynamic—multiple scans are necessary for reliable results.
RF Spectrum Analyzers vs. Broadband RF Meters
| Tool | Strengths | Limitations |
|---|---|---|
| RF Spectrum Analyzers | Detailed frequency visibility, peak detection, source identification | Technical learning curve |
| Broadband RF Meters | Fast overall exposure readings | Cannot identify individual frequencies |
For full-scale EMF assessments, both tools complement each other. Broadband meters provide quick exposure levels, while RF Spectrum Analyzers reveal the underlying signal structure.
FAQs About RF Spectrum Analyzers
Do RF Spectrum Analyzers measure magnetic or electric fields?
No. They detect only radiofrequency signals.
Can a beginner use one?
Yes, especially handheld models with simplified interfaces.
Do RF Spectrum Analyzers detect 5G?
Yes, as long as the frequency range covers the relevant 5G bands in your area.
Do walls block RF signals?
Partially. Materials like concrete, brick, metal, and Low-E glass reduce RF transmission, while wood and drywall offer minimal attenuation.
Key Takeaways
- RF Spectrum Analyzers provide frequency-specific visibility into wireless environments.
- They detect peaks, modulation patterns, and intermittent signals that broadband meters cannot identify.
- Proper settings—including RBW, frequency range, and peak modes—are crucial for accurate measurements.
- They are ideal for identifying Wi-Fi, Bluetooth, cell tower, and smart meter activity.
- For a complete overview of EMF measurement tools, visit:
https://frequencyblockers.com/emf-testing-tools/
References
- National Institute of Standards and Technology (NIST) — Spectrum Measurement Guidelines
https://www.nist.gov - Frequency Blockers — EMF Testing Tools Overview
https://frequencyblockers.com/emf-testing-tools/
Frequently Asked Questions
What can an RF spectrum analyzer actually measure in my home?
An RF spectrum analyzer measures radiofrequency power levels, frequency patterns, and signal activity from sources like Wi-Fi routers, smartphones, and smart meters in real time. It displays the amplitude (strength) and frequency signature of each RF source, allowing you to identify which devices are transmitting and at what power levels.
Can I use an RF spectrum analyzer as a beginner without professional training?
Yes, beginners can use handheld or USB-based RF spectrum analyzers by following basic steps like selecting the correct frequency range and scanning slowly through your environment. However, interpreting the data accurately requires understanding concepts like amplitude, frequency signatures, and duty cycles, so reviewing educational resources or guides is recommended.
Do RF spectrum analyzers detect 5G signals?
Yes, RF spectrum analyzers can detect 5G signals if they have sufficient frequency coverage, typically extending to 6 GHz or higher depending on the model. You’ll see 5G transmissions displayed as specific frequency signatures on the analyzer’s screen when scanning areas with 5G tower coverage or devices.
How do RF spectrum analyzers differ from standard RF meters for EMF assessment?
RF spectrum analyzers provide detailed frequency-specific data showing individual signal sources, peak power levels, and real-time patterns, while broadband RF meters only give overall RF exposure readings without identifying specific sources. This makes spectrum analyzers superior for troubleshooting wireless interference, finding hidden signals, and conducting comprehensive EMF assessments.